Use Oracle JET to monitor Weblogic queues

At a customer we are working in an Oracle Fusion Middleware environment. In this environment we created queues. These queues are configured with an error queue when messages could not be delivered. In this blog post I will show how to monitor these queues from an Oracle JET application.
Because there are a number of error queues, monitoring is a lot of work. You have to check each queue independently. Recently I ran into this blog of Frank Munz (link). In this blogpost he talks about the framework Jolokia. This framework offers remote JMX access. More information about Jolokia can be found here.
With Jolokia you can request Weblogic MBean data and the response can be defined as JSON. So when I read this, I thought this is the solution to monitor the error queues.
What I did is the following:
First install Jolokia as an application. From the website you can download a WAR. This can be installed as an application in Weblogic. When you have an environment with managed servers and you want to read data from these servers you must also target the WAR to the managed servers.
Then I created an Oracle JET application. In this application I made a JQuery.Ajax call to the REST service of the error queue. This is the url: http://<host>:<port/jolokia/read/com.bea:JMSServerRuntime=<JmsServerName>,Name=<JMS ModuleName>!!<JmsServerName>@<QueueName>,ServerRuntime=<serverName>,Type=JMSDestinationRuntime/MessagesCurrentCount
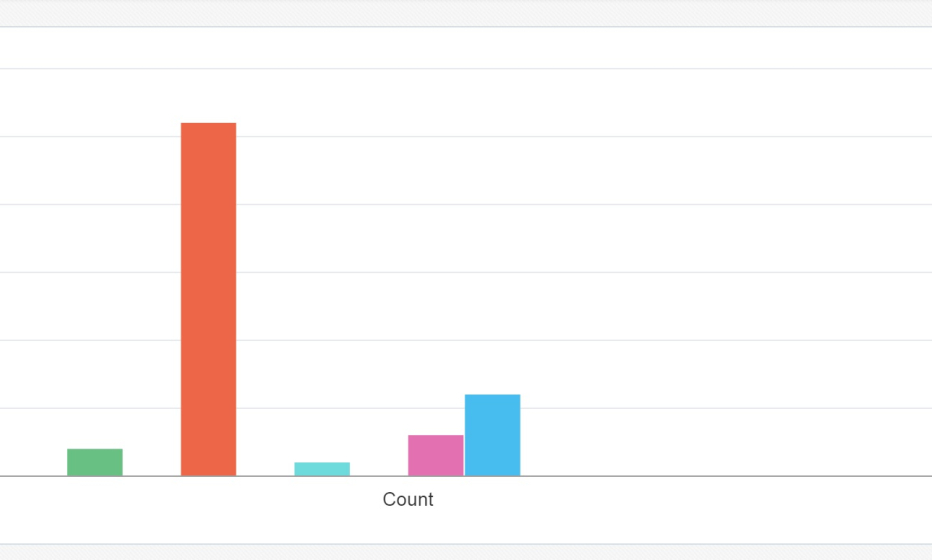
In the response you can read the current messages that are on the queue with the use of the variable MessagesCurrentCount. Add the value to an array and you can use the array in a chart for the JET application.
You can see the result in the next image:


